A successful web presence isn’t just about having a professional looking website. It’s about driving targeted traffic to that website, attracting an audience who is interested in the products or services that you’re offering. But how do you know if the digital marketing strategies you’re employing are working? You need data.
That’s where Google Analytics comes in. This tool is a game-changer for understanding your audience and making your marketing efforts pay off. Let’s unpack the importance of Google Analytics in digital marketing for your business.
Key Takeaways
- Google Analytics helps you get to know your website visitors by showing you their demographics and how they interact with your site.
- You can track your website’s performance, seeing which pages are popular and how long people stay, which tells you what content is hitting the mark.
- It lets you measure how well your marketing campaigns are doing, showing you what’s bringing in customers and if you’re getting a good return on your spending.
- By looking at how users move through your site, you can find ways to make their experience better and easier.
- Ultimately, Google Analytics provides the data you need to make smarter decisions, helping your business grow online.
Understanding Your Audience with Google Analytics
Knowing who is visiting your website is the bedrock of any successful digital marketing strategy. Google Analytics provides you with a clear picture of your audience, moving beyond simple visitor counts to reveal who they are and what they’re interested in. This information is gold for tailoring your marketing efforts and making sure you’re speaking directly to the right people.
Demographics and Interests
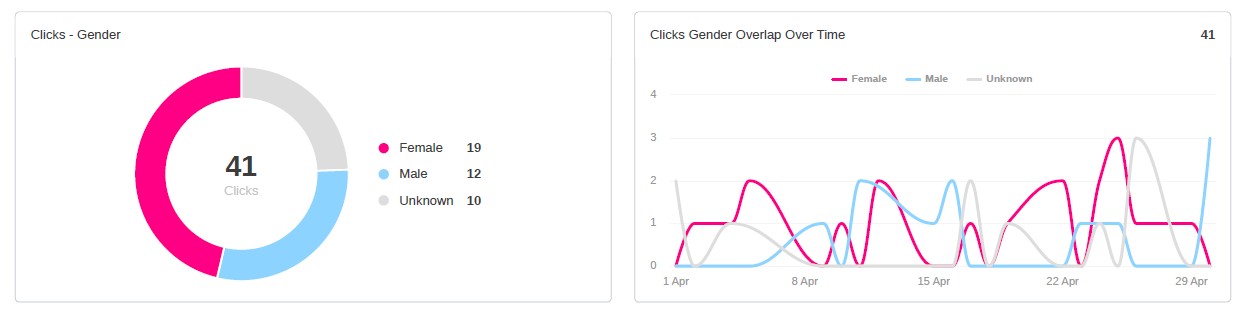
Google Analytics offers a look into the age, gender, and general interests of your website visitors. This data helps you understand if your marketing is reaching the demographic you intended. For instance, if you’re selling handmade jewellery, you’d want to see if your audience aligns with those typically interested in fashion and accessories. This insight allows you to refine your ad targeting and content creation to better match your ideal customer.
User Behaviour and Engagement
Beyond who your visitors are, it’s vital to know what they do once they land on your site. Google Analytics tracks how users navigate your website, which pages they spend the most time on, and how they interact with your content. Are they clicking on your calls to action? Are they bouncing off certain pages quickly? Understanding these behaviours helps you identify what’s working and what isn’t, allowing you to improve the user experience and guide visitors more effectively towards your business goals.
Analysing user behaviour isn’t just about seeing what pages are popular; it’s about understanding the journey your visitors take. This helps you spot where they might be getting stuck or losing interest, so you can make changes to keep them engaged and moving forward.
Setting up Google Analytics (GA4) on your website.
Here’s a comprehensive guide to setting up Google Analytics 4 (GA4) on your business website:
Step 1: Create a Google Analytics Account
First, you’ll need a Google Analytics account:
- Go to analytics.google.com
- If this is your first time using Google Analytics, click “Start Measuring”
- Provide an account name and configure the data-sharing settings to control which data you share with Google
Step 2: Create a GA4 Property
You need the Editor role to add properties to a Google Analytics account:
- Enter a name for the property (e.g. “My Business, Inc website”) and select the reporting time zone and currency
- Select your industry category and business size
- Choose how you intend to use Google Analytics (this tailors your default reports)
- Accept the Analytics Terms of Service
Step 3: Add a Data Stream
In Admin, under Data collection and modification, click Data Streams:
- Click “Add stream” and select “Web”
- Enter the URL of your primary website, e.g., “example.com”, and a Stream name, e.g. “Example, Inc. (web stream)”
- You have the option to enable or disable enhanced measurement. Enhanced measurement automatically collects page views and other events
Step 4: Install the Tracking Code
You have three main options for implementation:
Option A: CMS Integration (Easiest)
Many CMSs have native integrations with Google Analytics 4. Popular platforms include:
- WordPress (using Site Kit plugin)
- Shopify
- Squarespace
- Wix
- HubSpot
Simply find your Google tag ID (starts with “G-“) from your data stream and paste it into your CMS’s Google Analytics field.
Option B: Manual HTML Installation
You need access to the HTML for your web pages:
- Get your Google tag code from the data stream settings
- Paste your Google tag immediately after the
<head>on each page of your website
Option C: Google Tag Manager
For more advanced tracking, you can use Google Tag Manager to deploy the GA4 configuration tag.
Step 5: Verify Installation
Data collection may take up to 30 minutes to begin. You can then use the Realtime report to verify that you’re receiving data.
Important Notes
- If you choose a time zone that honours Daylight Savings Time, Analytics automatically adjusts for time changes
- Changing the time zone only affects data going forward
- Consider enabling enhanced measurement for automatic collection of common events like page views, scrolling, and file downloads
Once setup is complete, you’ll have access to comprehensive data about your website visitors, their behaviour, and conversion patterns to inform your digital marketing strategy.
Tracking Website Performance and KPIs
Understanding how your website is performing is absolutely key to digital marketing success. It’s not just about having a nice-looking site; it’s about making sure it’s actually doing the job you need it to do. Google Analytics gives you the tools to see exactly what’s happening, so you can stop guessing and start making smart choices.
Key Metrics to Monitor
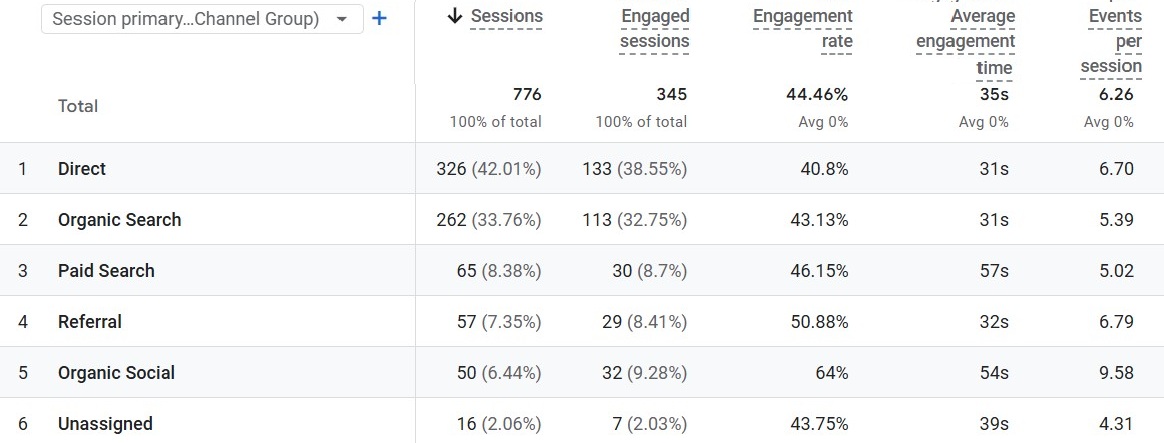
To get a real handle on your website’s performance, you need to keep an eye on specific numbers. These aren’t just random figures; they tell a story about your visitors and how they interact with your site. Focusing on the right metrics means you can pinpoint what’s working and what’s not.
- Traffic Sources: Where are your visitors coming from? Are they finding you through search engines, social media, or paid ads? Knowing this helps you see which marketing channels are most effective.
- Bounce Rate: This is the percentage of visitors who leave your site after viewing only one page. A high bounce rate on important pages might mean the content isn’t what they expected or the page isn’t engaging.
- Average Session Duration: How long do people stick around? A longer duration generally suggests they’re finding your content interesting and relevant.
- Page Load Speed: If your pages take too long to load, people will leave. This is a simple but significant factor in user experience and search engine rankings.
- Conversion Rate: This measures how many visitors complete a desired action, like making a purchase or filling out a form. It’s a direct indicator of your website’s effectiveness in achieving business goals.
Identifying Top-Performing Content
Your website’s content is what draws people in and keeps them engaged. Google Analytics can show you which pieces of content are hitting the mark and which ones might need a rethink. By understanding what your audience likes, you can create more of it.
Analysing which pages get the most views, how long people spend on them, and whether they lead to further actions, gives you a clear picture of what content truly connects with your audience. This insight is gold for refining your content strategy and ensuring you’re providing what your visitors are looking for.
Here’s how you can use Analytics to find your star content:
- Most Viewed Pages: Look at the ‘Pages and Screens’ report to see which pages attract the most traffic. These are often your entry points or key information hubs.
- Engagement Metrics by Page: Check the ‘Average Engagement Time’ for each page. Pages with higher engagement times are likely providing more value or are more interesting to your visitors.
- Content Leading to Conversions: Use goal flow reports or custom reports to see which pages are most effective at guiding users towards completing a conversion. This shows you content that not only engages but also persuades.
Measuring Marketing Campaign Effectiveness
Understanding how your marketing efforts are performing is absolutely vital for any Aussie business looking to grow. Google Analytics provides the tools to move beyond guesswork and see exactly what’s working and what isn’t. It’s about connecting your marketing spend to tangible results.
Attribution Modelling
Attribution modelling helps you understand which marketing touchpoints contribute to a conversion. Instead of just crediting the last click, you can see how different channels, like social media ads, email newsletters, or organic search, play a role throughout the customer’s journey. Google Analytics 4 offers data-driven attribution, which uses your account data to assign credit more accurately across all touchpoints. This means you can better understand the real impact of each campaign element.
ROI Analysis
Ultimately, you need to know if your marketing is profitable. By tracking conversions and linking them back to specific campaigns and their associated costs, you can calculate your Return on Investment (ROI). This involves comparing the revenue generated from a campaign against its total expenditure. For instance, if a Google Ads campaign cost $500 and generated $2,000 in sales, its ROI is 300%. Regularly analysing this data allows you to identify which campaigns are most effective and where to allocate your budget for the best results. Making informed decisions about campaign spend directly impacts your bottom line.
It’s easy to get lost in the numbers, but remember that data is there to inform human decisions, not replace them. Use the insights from Google Analytics to understand your audience better and refine your strategies, but always keep the customer experience at the forefront.
Optimising User Experience (UX)
Your website’s user experience, or UX, is how a visitor feels when interacting with your site. It’s not just about how it looks, but how easy and enjoyable it is to use. Google Analytics provides the data you need to pinpoint exactly where users might be struggling or getting frustrated. By understanding these pain points, you can make targeted improvements that lead to happier visitors and better results.
Understanding User Flow and Drop-off Points
Analysing user flow reports in Google Analytics shows you the path visitors take through your website. You can see which pages they land on first, where they go next, and crucially, where they leave your site. A high drop-off rate on a specific page, especially one that’s meant to lead to a conversion, is a clear signal that something isn’t working as it should. This could be confusing navigation, slow loading times, or unclear calls to action. Identifying these specific pages allows you to focus your optimisation efforts where they’ll have the most impact. For instance, if many users abandon your checkout process on the payment page, you’ll want to investigate that page’s design and functionality. You can also track specific goals, like form submissions or purchases, to see how many users complete these actions and at what stage they might be exiting. This detailed view helps you refine the journey for your customers.
Analysing Page Load Speed and Mobile Responsiveness
Website speed is a massive factor in user experience. If your pages take too long to load, visitors will simply go elsewhere. Google Analytics can help you identify slow-loading pages, allowing you to address these issues. Furthermore, with the majority of internet traffic now coming from mobile devices, it’s vital that your website performs flawlessly on smartphones and tablets. You need to ensure your site is mobile-responsive, meaning it adapts its layout to fit any screen size without losing functionality or readability. Analytics can provide insights into how mobile users interact with your site, highlighting any specific device-related problems. Making your website fast and easy to use on all devices is key to keeping visitors engaged and encouraging them to convert. A well-optimised mobile experience can significantly boost your online presence.
Improving Navigation and Site Structure
Your website’s structure and navigation should be intuitive. Users should be able to find what they’re looking for quickly and easily. Analytics can reveal if users are struggling to find specific information, perhaps by looking at high bounce rates on key landing pages or by observing unusual navigation paths. If users are repeatedly clicking back to a previous page or using your site’s internal search function excessively, it suggests your main navigation might not be clear enough. Consider simplifying your menu, organising content logically, and ensuring that internal links are relevant and helpful. A well-structured site not only improves user satisfaction but also helps search engines understand and rank your content more effectively.

Making Data-Driven Decisions for Growth
Data-Driven Decisions for Continued Growth
Moving beyond simply collecting data, the real magic happens when you use those insights to make smarter choices for your business. This is where Google Analytics truly shines, transforming raw numbers into actionable strategies. Instead of guessing what might work, you’ll be making informed decisions based on how real people interact with your online presence.
Key Steps for Data-Informed Growth
To effectively use your data for growth, consider these practical steps:
- Review your website performance regularly: Keep an eye on load times, how well your site works on mobile devices, and the overall user journey. Are people getting stuck anywhere?
- Assess your social media engagement: Understand which platforms are bringing in the most interaction and which content types are really connecting with your audience.
- Examine your SEO health: Check if you’re appearing in search results for the terms your potential customers are actually using. Are your business listings up-to-date and optimised?
- Analyse your email marketing results: Look at open rates and click-through rates. Are your emails prompting action?
- Evaluate paid ad performance: See how your campaigns on platforms like Google and Facebook are performing. Are they bringing in valuable leads or just clicks?
Understanding Your Data Sources
It’s important to look at where your data is coming from. Google Analytics 4 (GA4) is your primary tool for understanding user behaviour on your website. However, don’t forget to cross-reference this with your Customer Relationship Management (CRM) system. This combination gives you a much clearer picture of the entire customer journey, from initial interest to final conversion. Comparing organic reach against paid media results also helps you see where your budget is most effective and where you might be spending unnecessarily.
Relying solely on vanity metrics like ‘likes’ or ‘shares’ can be misleading. While they indicate brand awareness, they don’t always translate into tangible business outcomes like sales or bookings. Focus on metrics that directly impact your bottom line.
Focusing on What Matters Most
Sometimes, you might see a lot of clicks on your Google Ads, but if those clicks aren’t leading to actual bookings or sales, the ad spend isn’t effective. Similarly, high website traffic is great, but if those visitors aren’t converting into leads or customers, you need to investigate why. It’s about understanding the quality of the traffic and engagement, not just the quantity. By looking at conversion rates and the behaviour of your visitors, you can identify what’s truly driving business results.
Conclusion: Leveraging Google Analytics for Digital Marketing Success
The Path Forward
Bringing all these elements together, Google Analytics acts as your digital compass. It’s not just about looking at numbers; it’s about understanding the story those numbers tell about your customers and your business. By consistently using the insights gained from your website data, you can make smarter choices about where to invest your marketing time and budget. This means focusing on what genuinely works for your Aussie audience, rather than guessing.
Embracing Data-Driven Growth
Think of Google Analytics as an ongoing conversation with your customers. You listen to what they do on your site, what they respond to, and what they ignore. This feedback loop is invaluable. It helps you refine your website design, improve your content, and make your marketing campaigns more effective. The businesses that thrive in the digital space are those that adapt based on real data, not just intuition.
Key Takeaways for Aussie Businesses
- Know Your Audience: Understand who is visiting your site, where they come from, and what they’re interested in.
- Measure What Matters: Keep an eye on key performance indicators (KPIs) that align with your business goals.
- Track Campaign Success: See which marketing efforts are bringing in results and which aren’t.
- Improve User Experience: Use data to make your website easier and more enjoyable to use.
- Make Informed Decisions: Let analytics guide your strategy for growth.
The digital landscape is always changing, and staying ahead means being able to understand and react to customer behaviour. Google Analytics provides the tools to do just that, helping you connect with your audience more effectively and achieve your business objectives.
Putting Your Data to Work
So, as you can see, understanding what your customers are doing online is pretty important for any Aussie business wanting to grow. Google Analytics, especially the newer GA4 version, gives you a real look at how people find you, what they like on your site, and if they’re actually doing what you want them to do, like buying something or getting in touch. It’s not just about looking at numbers; it’s about using that information to make your website and your marketing work better for you. By paying attention to what the data tells you, you can make smarter choices, spend your money more wisely, and ultimately, help your business connect with more customers right here in Australia.
Frequently Asked Questions
What exactly is Google Analytics and why should my Aussie business care about it?
Google Analytics is like a super-smart detective for your website, helping you understand who visits your site, what they do, and how they find you. It’s essential for Aussie businesses because it shows you what’s working and what’s not with your online efforts, so you can make better choices to grow your business.
How does Google Analytics help me understand my customers better?
You can use it to see who your visitors are – like their age, where they live, and what they’re interested in. It also shows you how they move around your website, which pages they like best, and how long they stay. This helps you understand your customers better and make your website more appealing to them.
How does Google Analytics help me track my website’s performance?
It’s crucial for tracking how well your website is performing. You can see important numbers like how many people visit, where they come from (like Google search or social media), and if they do what you want them to, like buying something or signing up. This helps you see if your online efforts are paying off.
Can Google Analytics tell me if my marketing campaigns are actually working?
Google Analytics lets you see which marketing campaigns are bringing in the most customers and sales. By understanding where your customers come from and what influences their decisions, you can figure out which ads or promotions are giving you the best bang for your buck, helping you spend your marketing money more wisely.
How can Google Analytics help improve the experience for people visiting my website?
Absolutely! By looking at how people use your website, you can find things that might be confusing or frustrating for them, like tricky navigation or slow loading pages. Fixing these issues makes your website easier and more enjoyable to use, which can lead to more happy customers.
How does using Google Analytics lead to better business decisions?
It gives you the facts to make smarter decisions. Instead of guessing what might work, you can look at the data to see what your customers actually want and how they behave. This means you can adjust your strategies, improve your website, and focus on what truly helps your business grow.
Share this article
A quick overview of the topics covered in this article.
Latest articles

October 15, 2026

October 15, 2026